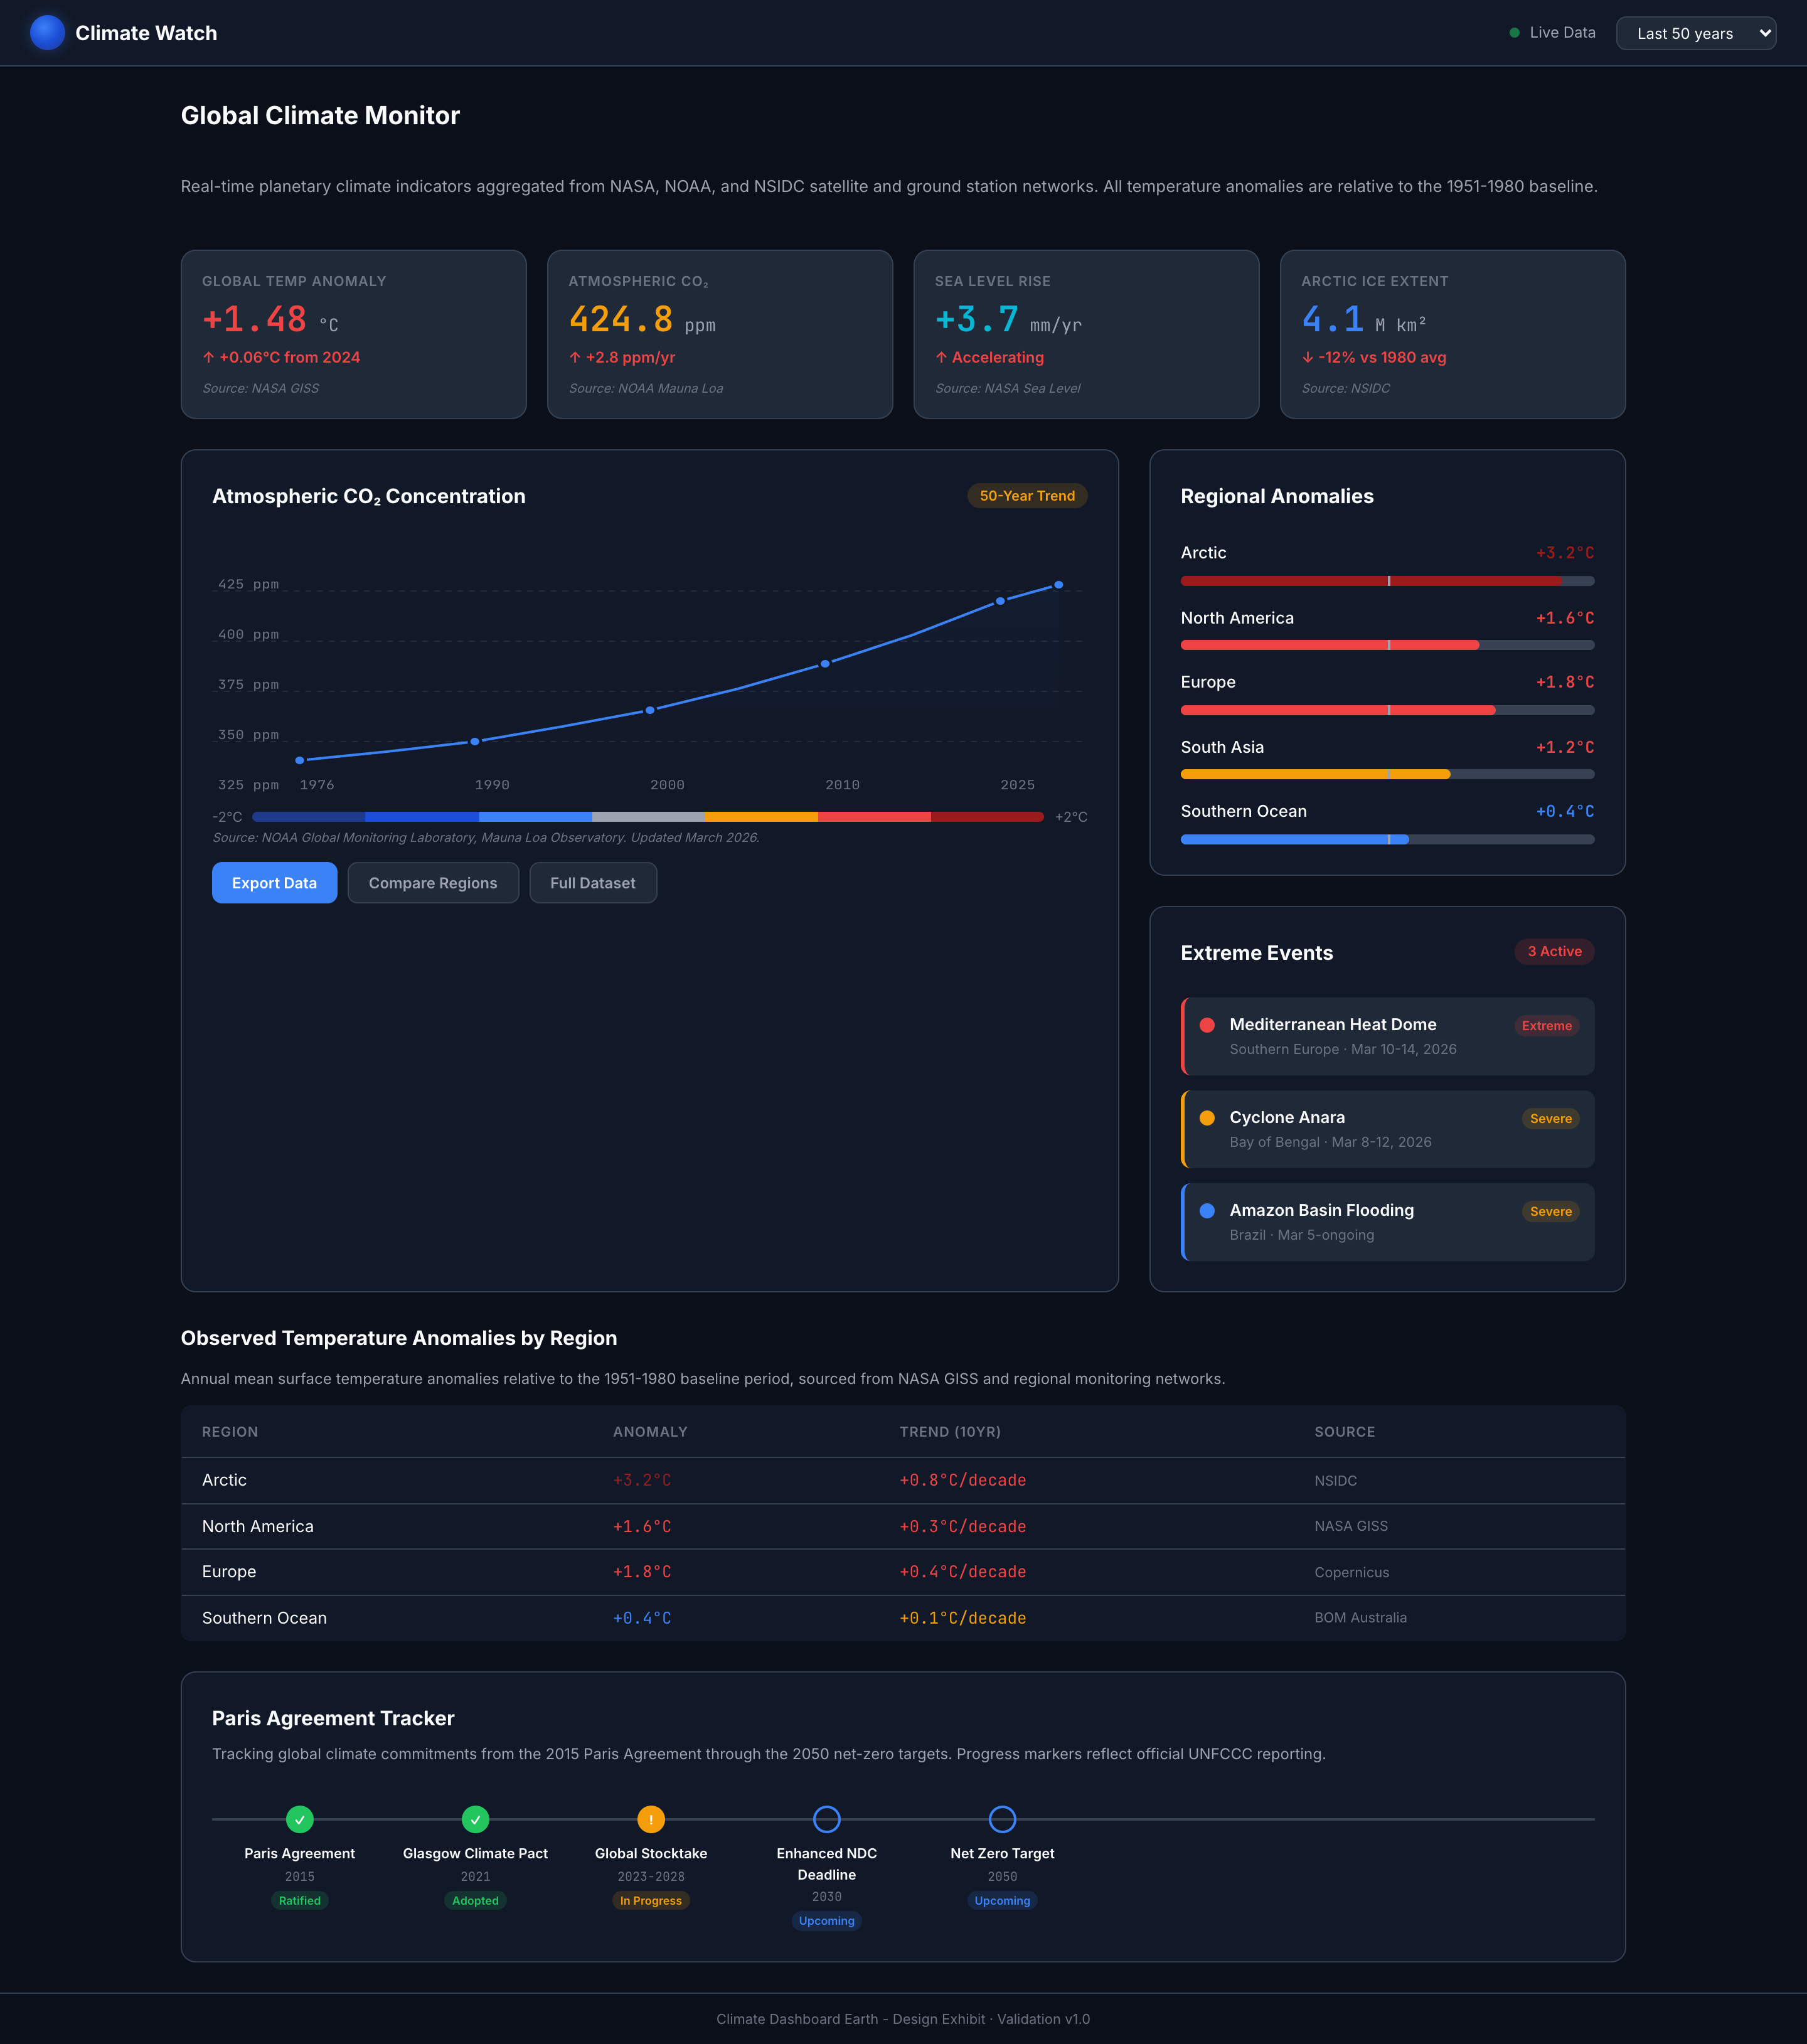
Climate Dashboard Earth
A planetary-scale climate monitoring design system with dark space backgrounds for globe visualization, temperature anomaly scales, CO2 trend charts, regional comparison bars, and policy tracker timelines using scientific precision and data
Design Language
A dark, scientifically precise climate monitoring design system that uses Earth blue as its identity color, a cool-to-warm temperature anomaly scale, and space-dark backgrounds to present global climate data, CO2 trends, regional comparisons, and policy milestones with labeled axes, data citations, and planetary-scale visual authority.
Agent instructions (SKILL.md)(advanced)
Design Skill
This Design Skill provides a scientifically precise, visually authoritative foundation for climate monitoring dashboards. It covers globe/map visualizations on dark space backgrounds, CO2 trend charts, temperature anomaly scales, regional comparison bars, extreme weather event tracking, and policy milestone timelines. The system enforces data source citations, labeled axes, and a semantically meaningful temperature color scale.