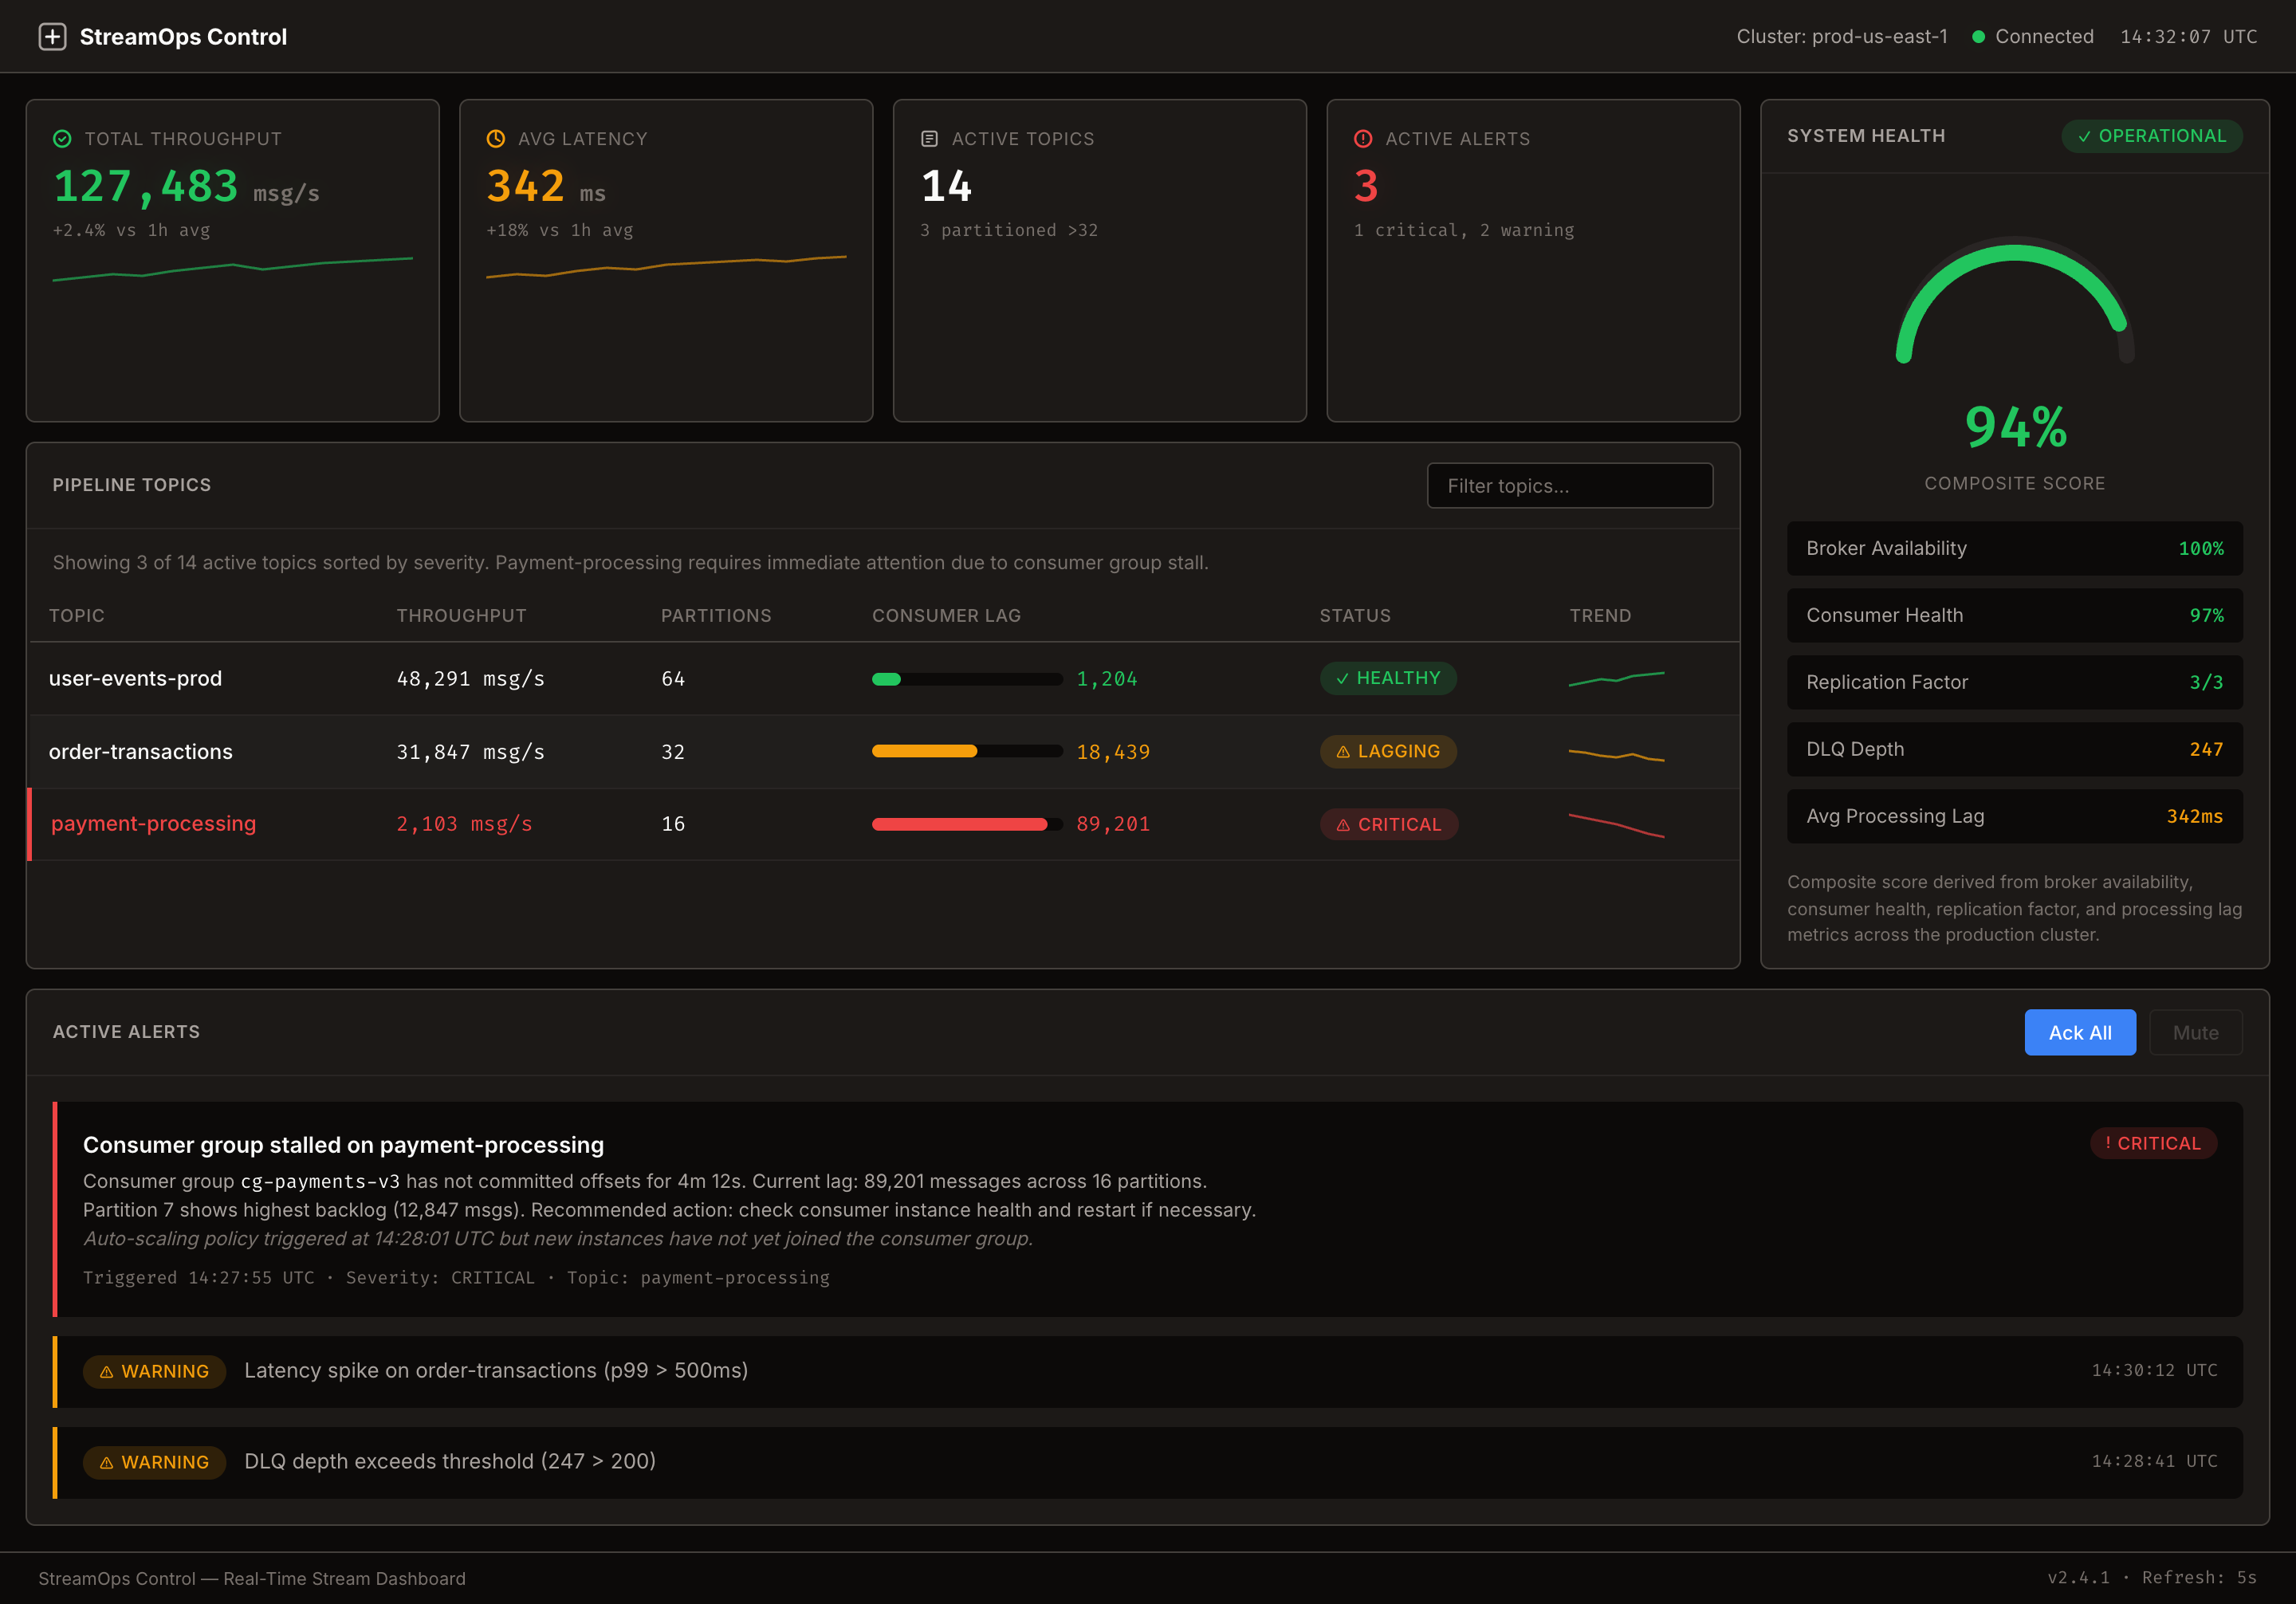
Real-Time Stream Dashboard
A mission-control density dark dashboard for live data pipeline monitoring, built around throughput gauges, anomaly alerts, consumer lag waterfalls, and monospace numeric readouts with severity-classified color coding.
Design Language
A high-density dark-mode monitoring dashboard using mission-control aesthetics, severity-classified color coding (green/amber/red), monospace numeric readouts, and real-time pulse animations to surface pipeline health across throughput, lag, and anomaly dimensions.
Agent instructions (SKILL.md)(advanced)
Design Skill
This Design Skill provides a complete dark-mode monitoring dashboard language for real-time data pipelines. It establishes mission-control density with strict severity color coding (green/amber/red), monospace numeric readouts via Fira Code, and real-time pulse animations on live metrics. The system covers throughput gauges, anomaly alerts, consumer lag waterfalls, dead letter queue inspection, and overall system health visualization.